2024 Annual Sewage Spill Data: What does it tell us?
This week, the summaries of the 2024 event duration monitoring on CSOs in England and Wales were released. Our technical experts dug into the data on raw sewage spills into our rivers so you don’t have to — and it’s not good news.
28/03/25
News
This week the Environment Agency released the annual summary of storm overflow (CSO) spill data, also known as EDM data, from water companies in England for 2024. Perhaps unsurprisingly, it’s far from good news for rivers.
With raw sewage spilled in England's rivers for an all-time high of over 3.6 million hours, it’s clear that significant progress to address this form of pollution was not made in 2024.
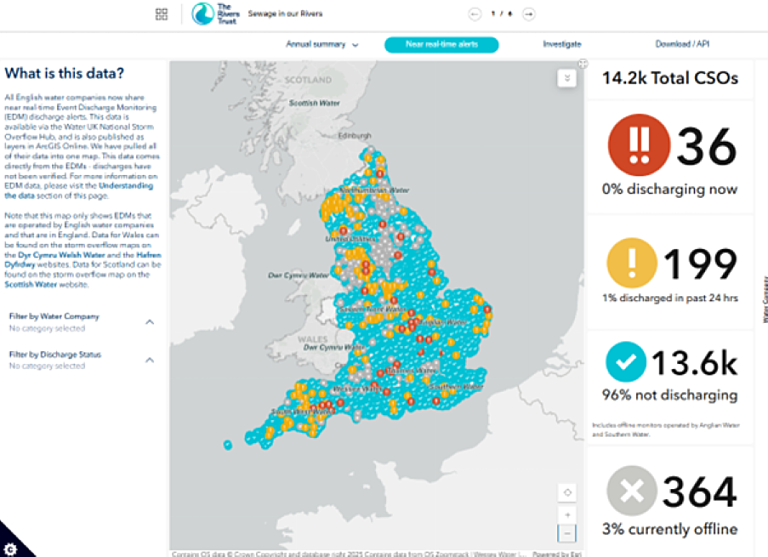
If you're concerned about spills in your local area, you can check the Near real-time alerts tab of our Sewage Map to identify your nearby CSOs, and see whether a spill is currently occurring or when it most recently discharged and for how long.
We've looked at the data
In 2024 across England:
- A total of 450,398 discharges, or monitored spill events, were counted.
- Untreated sewage was discharged for a record total of 3,614,427 hours through storm overflows – 8,558 hours more (0.22%) than last year.
- On average, each overflow recorded 31.8 spills. In 2023, this was 33, 2022, this was 23, and in 2021, this was 29. The Government’s target for this is less than 10 per year.
- On average, each overflow discharged for 8 hours each time a spill took place – slightly longer than 2023 (7.8h), and much longer than in 2022 (5.8h).
What's in the number of CSOs?
It's really important to know how many overflows are monitored each year. The number of CSOs listed declined slightly in 2024 from 2023, and that’s because several water companies have given up some permits, meaning they are no longer legally able to spill untreated sewage at those locations.
In 2024, monitoring was carried out on 100 % of 14,254 storm overflows where monitoring was expected (a further 31 were not active or did not have monitoring requirements), in line with the Government’s target for 100% by the end of December 2023. In 2023 it was also 100%, and in 2022 it was 96%. This makes our year-on-year comparisons far more reliable.
Improving CSOs: a job Water Companies must address urgently
Only 200 storm overflows were improved in England in the last year, so it is disappointing but not surprising that we aren’t seeing significant reduction in the frequency or duration of untreated sewage spills yet. The water industry plans to improve 2,500 more over the next five years, but we continue to stress that urgency is needed so that we start to see significant improvement from 2025 onwards. Improving storm overflows involves investment or work that has been done to reduce spills.
This can include upgrades to the capacity of sewerage networks and the creation of more storage (i.e, reservoirs and tanks) to hold peaks of rainwater, as well as installing ‘smart’ technology like sensors that detect blockages before they trigger a spill. Work to slow the flow of rainwater reaching the sewer network is can also alleviate pressure on CSOs, and nature-based solutions that encourage land to hold water for longer can play a key part in this – swapping tarmac or concreted ground for grass or gravel that allows rain to soak in rather than flood drains, for example.
What does the weather have to do with untreated sewage spills?
Many of our sewers collect rainwater as well as sewage from our homes, so heavy rainfall can mean that all the water in the system is too much for our sewage treatment works to deal with. This combination of rain and raw or untreated sewage is only supposed to be discharged by water companies into our rivers and seas during heavy rains to prevent the sewerage system from becoming overwhelmed and flooding back up our drains into our homes. 2023 was a particularly wet year and while overall 2024 was drier, the winter and spring were periods were actually much wetter – in fact, the 12 months spanning October 2023 to September 2024 were the wettest on record.
Because of this heavy rainfall we would expect to see more spills from the early part of 2024 but less in second half compared to 2023 but the annual summary EDM data can’t tell us this.
The increased sustained rainfall across England will have had a significant impact on discharges, and with climate change we will see more extreme rainfall in coming years, combined with a growing population putting greater pressure on the sewage network. So, it is essential that investment in our water infrastructure is accelerated to keep up. The live sewage spill data we can now access shows that spills are still routinely happening during dry weather, so we’re continuing to demand strengthened regulatory oversight and stronger enforcement of the law.
The average number of spills for each storm overflow monitored is still more than 30. This indicates that our water infrastructure is not coping with increasingly unsettled weather patterns, and our rivers are paying the price for this.
In the coming weeks our technical experts will continue to examine today’s data in further detail to gain a clearer picture of how our sewer system is functioning. And of course, we will be updating our Sewage Map.
In 2024 across Wales:
Rivers in Wales are also on the receiving end of a deluge of raw sewage. It’s much harder to make reliable year-on-year comparisons with the Welsh data, especially in regard to spill counts and hours as the number of overflows being monitored has increased over the years, but it's still clear that spill levels are still concerningly high.
To generate statistics for all of Wales, our technical team has combined the data provided by Hafren Dyfrdwy and WW
- A total of 113,332 discharges were recorded. This is a small decrease of 1.79% from 2023 (115,385 spills).
- The duration of time in which CSOs spilled has decreased by just over 6% to 937,580 hours in 2024.
- Monitoring was carried out on 99.1% of 2341 storm overflows listed in the published data. However, on average the monitoring equipment was only operational for 93.29% of the time. The Gov target was for 100% by the end of December 2023, so there’s still plenty of work to be done. When this figure reaches 100%, year-on-year comparisons will be more reliable.
- The average number of hours that each overflow spilled for throughout the year has also decreased by around 16.2% (from 475.94 in 2023 to 404.13 hours in 2024).
- CSOs also overall spilled less frequently. The average spills per overflow have decreased from 55 in 2023, to 48.85 in 2024 (down 11.51%).
In 2024 across Northern Ireland:
Monitoring of CSOs is far sparser in Northern Ireland at the moment, but we do have some data to share.
Data is thin on the ground
- There are 131 CSOs in the NI Water EDM dataset.
- Of these, 122 have monitoring data for 2024 – ten fewer (or 8% less) than last year. According to NI Water, there are 2,440 storm overflows across Northern Ireland as of February 2025, meaning that only 5% of storm overflows have monitoring in 2024, and all of these CSOs are all on the coast. NI Water say that this is because storm overflows within a 2km distance of designated bathing waters were prioritized as the first locations for EDMs.
- There were 2,697 discharges in 2024.
- Each CSO spilled an average of 22 times.
- The total duration of these spills is 9662 hours, so each overflow spilled an average of 79 hours last year.
- It also means the average length of a spill was 3.6 hours.
- The average operation of CSOs in Northern Ireland in 2024 was 92.9%.
There are nine CSOs in the dataset without EDM monitoring resulting from 'EDM instrumentation and/or signal failure in period', and have maintenance scheduled.
There isn't enough data to make meaningful year-on-year comparisons for Northern Ireland.
What's in your river? Use our Sewage Map
The 'Near real-time alerts' tab of our sewage map shows live spill data for CSOs in England. This can help you easily see whether your nearby storm overflow is discharging, or when it most recently discharged as well as how long that spill took place for. Our technical experts are also working on updating the 'Annual Summary' tab with the data released this week, this will be available soon.