State of Our Rivers Report: Our team’s favourite interactive maps (and what they can tell us about river health)
Explorable maps are a great way to understand the river health data at our fingertips and learn more about your local river. Get started with some of our favourites from the 2026 State of Our Rivers Report.
03/11/26
The third edition of the State of Our Rivers Report, published in October 2026, is a bumper edition. It is packed with the latest information on the pressures faced by rivers in the UK and Ireland, the symptoms they are displaying, and hopeful stories which illustrate the positive power of local action – aided, of course, by a suite of interactive maps. It’s a digital feast for decision-makers, conservationists, nature lovers, and anyone curious to learn more about the health of their local river.
There are over ten maps to choose from in the main report alone, and several more in the report’s associated deep dives. It’s these maps, created by the experts in The Rivers Trust Tech Team, that enable anyone to explore and find personal meaning in the latest data. After all, who enjoys digging through a massive spreadsheet for information (except, perhaps, our Tech Team themselves)?
Want to know where your closest river bathing waters site is, or whether beavers or invasive species have been spotted near you? If your local rivers have a good ecological health score, or if they've got barriers in that could be impeding wildlife passage? Simply click, zoom, and navigate to your heart’s content.
To help you get started, our team, including some of the mapmakers, have shared their favourite map from the report:
River barriers map
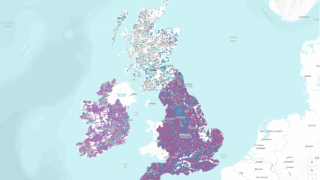
Barriers such as weirs, dams, culverts, and sluices can impede wildlife movement up and down rivers – something required by migratory species, like Atlantic salmon and European eels, as a key part of their lifecycle. Some redundant barriers need removing, and at others, fish and eel passes can be installed to allow water and wildlife flow, but the best plans rely on knowing where the obstacles in a catchment are.
Josh Jones, Senior Technical Analyst and creator of this map:
“I've been working on river fragmentation since 2017, so barriers (also known as river obstacles) are my pet topic. In that time, I've analysed, published and promoted the data and the impacts of barriers nationally in the UK and Europe. I use the data to generate estimates of fragmentation that help The Rivers Trust, our Movement and other conservationists plan river restoration work and obstacle easement efforts that can have big impacts, and I hope that after viewing the map in the State of Our Rivers Report, more people will be aware of and understand the scale of barriers as an issue faced by our rivers.”
Find it in the Wildlife chapter.
The river bathing waters map
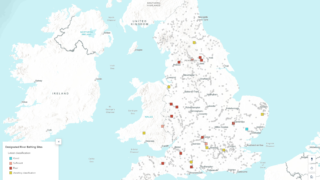
It’s thought that 4 million people in the UK are open water swimmers, enjoying the mental and physical benefits of taking a dip in our rivers, lakes and seas. In England, however, while there are over 3,300 known river recreation spots (and likely far more that aren’t recorded), just 22 locations in England and Wales are designated River Bathing Water sites, and of those, just three meet sufficient standards for bacterial water quality.
Michelle Walker, Technical Director and creator of this map:
“I enjoyed making this map because it's so heartening to see 22 designated river bathing water sites - this may still be a small number, but when The Rivers Trust first started campaigning on this in 2019, there were none. If I'd been told back then where we'd be now, even 22 would have felt impossible. We've come a long way and have played a key part in raising the issue of river and human health up the public and political agenda, and I hope people using the map will be inspired to know that these designations have also been driven and made possible by local communities. We can all make a difference, whether we’re charities or communities.
"You can use the map to find out where your nearest designated River Bathing Water is, see the latest water quality classification. You can also see which other locations people already use the river even without official designation. I know people will also be concerned about poor water quality, but I hope that people can be inspired to become advocates for their rivers. The map also shows thousands of other sites where people use their rivers for recreation - rivers mean so much to so many, and it’s critical we stand up for them.
Find it in the Rivers & Us chapter.
Invasive Species Map
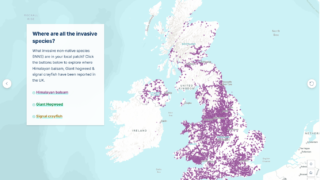
Invasives are species that are not native to a region, and cause damage such as bank erosion or biodiversity reduction. And you may be living much closer to a species that threatens your local river than you think! You may even admire the beauty of some of them, like the pink-flowering Himalayan balsam, when in bloom along the riverbank. Mapping their location helps us identify the best places to target removal action – particularly if there are hotspots that are easy for volunteers to access and get involved, or if we can identify that an area that is currently free of a species might be at risk of a nearby population travelling into it.
Tom Gall, Ecosystem Services Data Analyst:
“The map of reported Himalayan balsam occurrences is a real standout for me, simply because the sheer scale of its distribution is mind-blowing. From the far west of Cape Cornwall to the Orkney Islands, it really brings home the scale of the challenge we face in tackling invasive non-native species. I also love that you can use it to explore observations in your own local area, perhaps even recognising places you’ve walked yourself. Hopefully, it inspires more people to get involved in tackling invasive species, whether that’s contributing to citizen science by recording sightings through the INNSMapper app or joining a local volunteer group for some balsam bashing!”
Find this map in the Wildlife section, at the end of a swipe-able carousel on Invasive Species. The map also shows where invasive Giant hogweed and Signal crayfish have been reported.
Beaver map
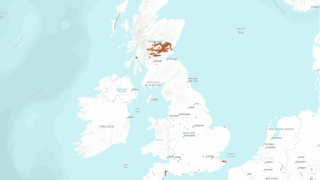
From water voles to white-clawed crayfish, a variety of native species are being reintroduced to our rivers to help restore ecosystems. One such species is the Eurasian beaver, an important, herbivorous ecosystem engineer that’s also cute enough to draw many of us to the riverbanks in hope of a sighting at dawn or dusk – something that a map is increasingly useful for. Populations are increasingly living wild across the UK and can sometimes cause issues for landowners or communities, so it’s also important to know where they are in any catchment to get ahead of potential issues.
Emma Brisdion, Communications & Campaigns Manager and report co-author:
“It’s a bit of a cliché that beavers have become a poster species for river restoration, but that doesn’t change how exciting it is to see them living in our landscapes after 400 years of extinction, both in enclosures and in the wild. Their quiet determination to engineer a watercourse through activities like damming and coppicing vegetation, not just to better suit their own needs in terms of water depth and food availability, but also to dramatically benefit myriad other species by cleaning water and creating diverse flood- and drought-resistant habitats, is hard not to admire. Their reintroduction to our rivers is relatively recent, and though the known beaver sightings map shared in the State of Our Rivers Report still contains many beaver-free regions, it’s brilliant to see them beginning to spread across countries they should never have been absent from. Plus, it’s a map that any of us can help add to by reporting beaver sightings in the Mammal Mapper app.”
Find this map in the Wildlife section.
Riverfly monitoring map
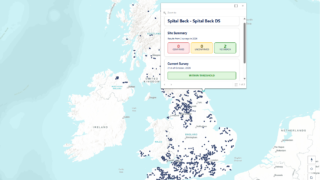
Riverflies are commonly used as a useful barometer for river ecosystem health. Each species of these aquatic invertebrates is differently sensitive to pollution or habitat changes, so by sampling and counting populations at the same spot regularly, we can get a sense of how (or whether) a river is being affected by pollutants over time, and identify the best way to deal with the issue. The riverfly map in the State of Our Rivers Report pulls together data from UK communities that have taken time to monitor for riverflies and shares the latest results recorded at each site.
Alfie Kelly, Senior Technical Analyst (Geospatial), and creator of this map:
“I love visualising and showcasing citizen science data, and the riverfly map is a great example of the widespread impact that volunteers can have. The Riverfly Partnership is one of the largest citizen science initiatives in the UK, so it's rewarding to see thousands of observations brought together into a single map that highlights the scale of community involvement in river monitoring. I hope that it helps people appreciate the incredible contribution that citizen scientists make to understanding the health of our rivers, and inspires more readers to get involved!
"One of the biggest challenges in making this map was keeping it simple and accessible for non-technical users, while still making the underlying data available. We focused on sites sampled in 2026 to give a clear overview at a glance, but also included clickable pop-ups for each site for anyone wanting to dig deeper into the monitoring history and the number of times trigger levels have been breached. This approach allowed us to balance simplicity with detail.”
Ecological health status map
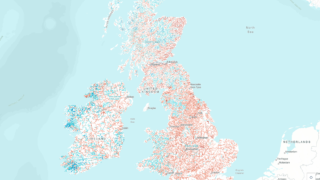
The report’s very first map displays the most recent ecological health status of river stretches across the UK and Ireland, which are classified as bad, poor, moderate, good or high, and colour-coded from red to blue accordingly. It provides a nationwide snapshot of river health and shows how widespread poor river health really is, but also allows users to zoom in and dig into the classifications assigned to specific river stretches.
Hannah Banton, Technical Analyst, helped create this map:
"One of my favourite maps in the report uses Water Framework Directive (WFD) data. Visually, we designed the ecological health map to display really clearly where the problem areas are across the UK, but also invite a deeper exploration into local areas – which I always find interesting. I added clickable pop-ups for each of the river stretches displayed, and matched the colours to make it clearer to visualise the data. The map colours show the ecological health status, but in these pop-ups, I also added the other health classifications recorded for these river stretches – for example, you can click to learn more about the overall health and chemical health."
Find this map in the State of Our Rivers section at the top of the report.
Toxic Polyaromatic Hydrocarbons (PAHs) in England's National Park lakes
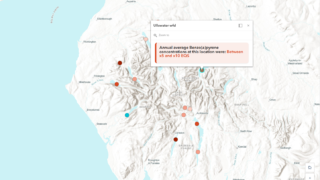
Polyaromatic hydrocarbons (PAHs) are toxic to aquatic life, and can interfere with our own hormones. England's national parks are supposed to be some of our most protected landscapes, yet our analysis of water samples taken from lakes across the Lake District shows that this form of chemical pollution is still reaching these important and much-loved bodies of water.
Harry Shepherd, Technical Analyst and creator of this map:
"Understanding chemical pollution in the UK can be difficult, with the data often behind a technical barrier, before even getting started on understanding what the data is showing. Working on the State of Our Rivers Report has enabled me to uncover what chemical data is showing, but also let me go beyond the numbers and really explore what those numbers mean, both in terms of our own human health, and the health of our rivers and national parks."
Find it in the report's deep dive on Chemical Pollution.
State of Our Rivers 2026
Our rivers aren't fit for the future. As the climate changes, the pressure on our rivers increases and urgent action is required.