Spring 2025 Big River Watch: What you saw, felt, and achieved for rivers
From spotting thousands of ducks to sharing your connection to rivers, explore the results of the most recent Big River Watch survey and join us as we reflect on the data you’ve collected on river health, after two years of Big River Watching.
20/05/25
Blog
This spring, between the 25th of April and the 1st of May 2025, thousands of you across the UK and Ireland joined forces for the latest Big River Watch, our biannual citizen science event where everyone is invited to spend time beside their local river and record what they see using our free survey app.
Together, an amazing 3,909 people took part and submitted 2,261 surveys. That adds up to 41 days of watching and recording observations of our precious waterways – from Stornoway in the Outer Hebrides to Dover on the English south coast For us, this was a particularly exciting ‘Watch’, as not only does it mark two full years of Big River Watch surveys (more on that later) but we also teamed up with Earthwatch’s Great UK WaterBlitz to offer you even more opportunities to gather river health data by measuring nitrates and phosphates in the water.
Our Tech Team have had a chance to comb through the data, and we’re delighted to be able to share the results of your efforts. Thank you, river champions - here’s what you saw during our Spring 2025 Big River Watch.
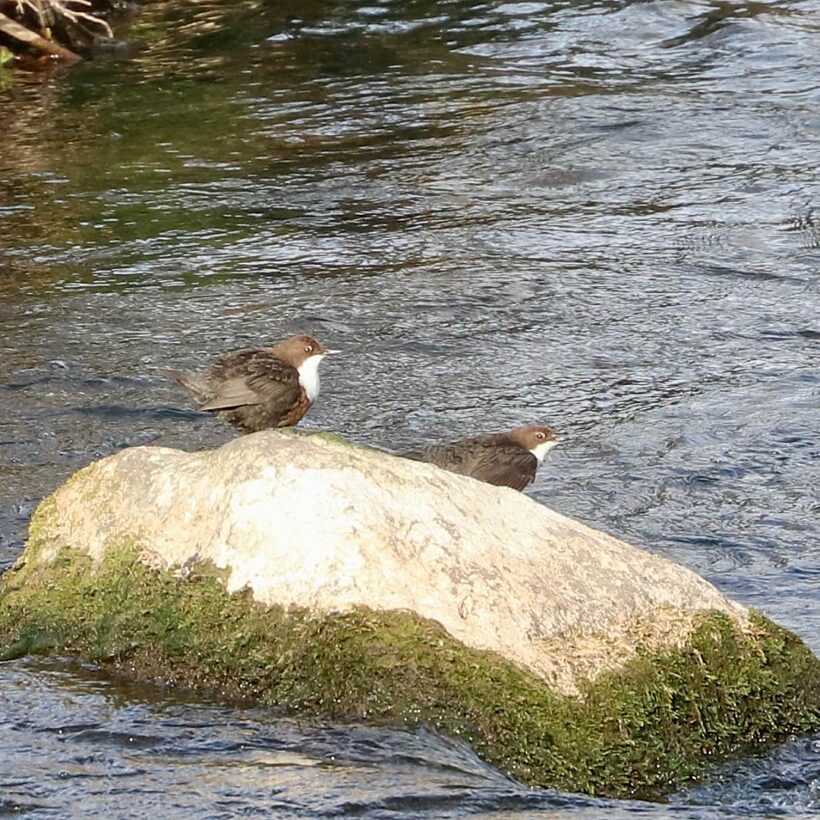
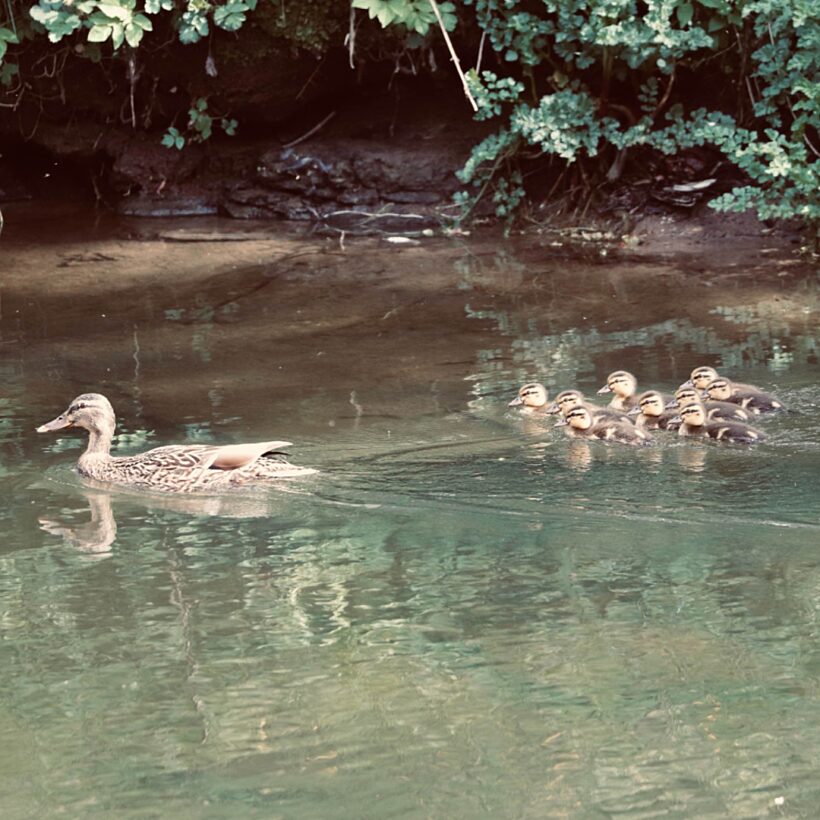
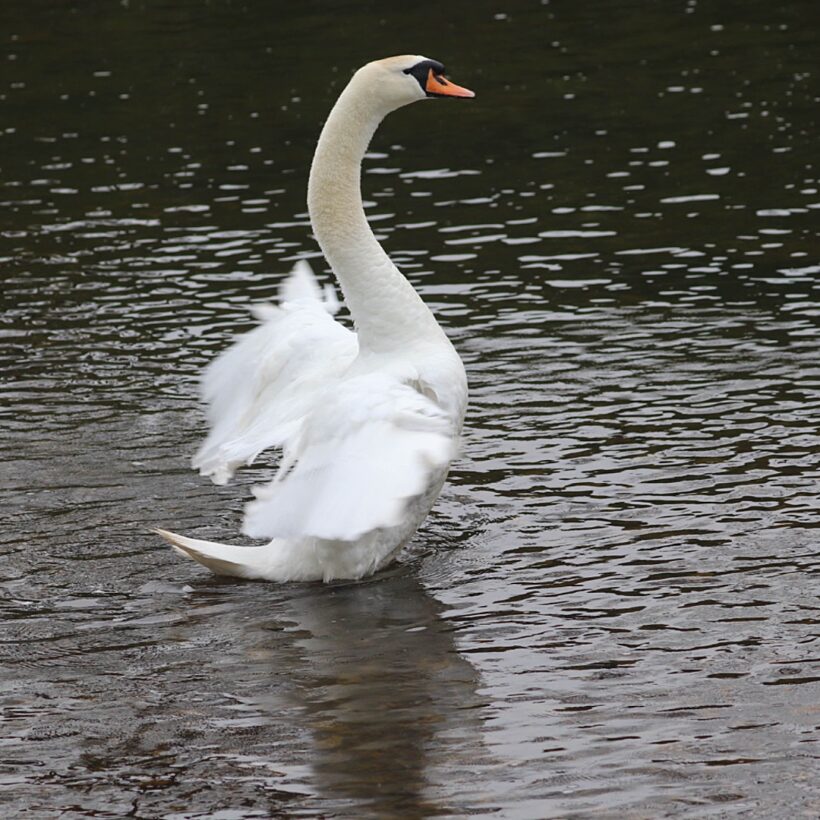
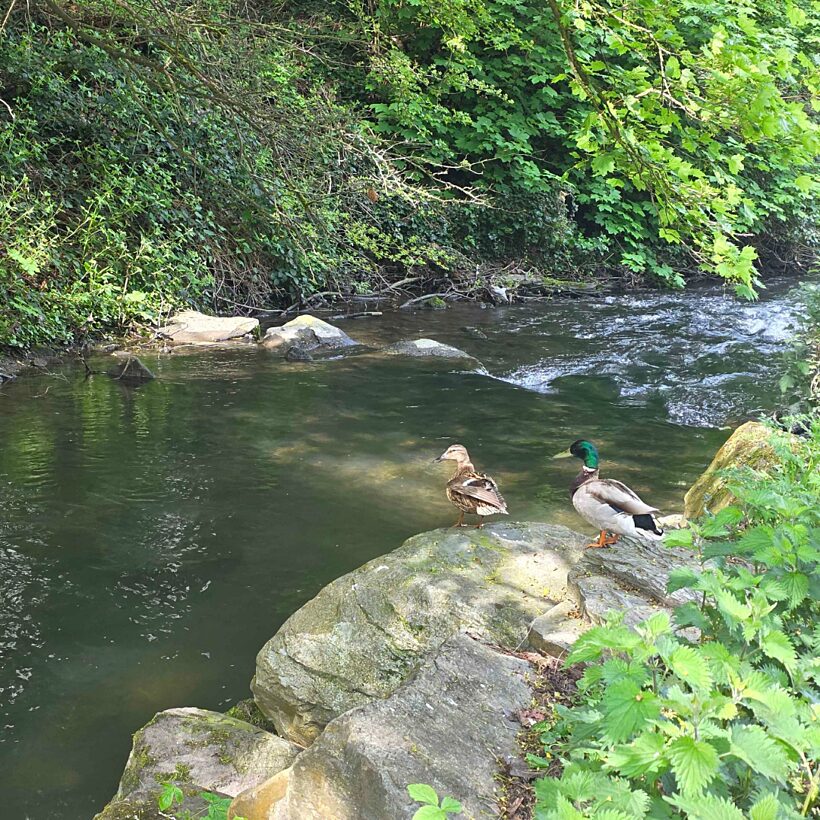
Wildlife by the water
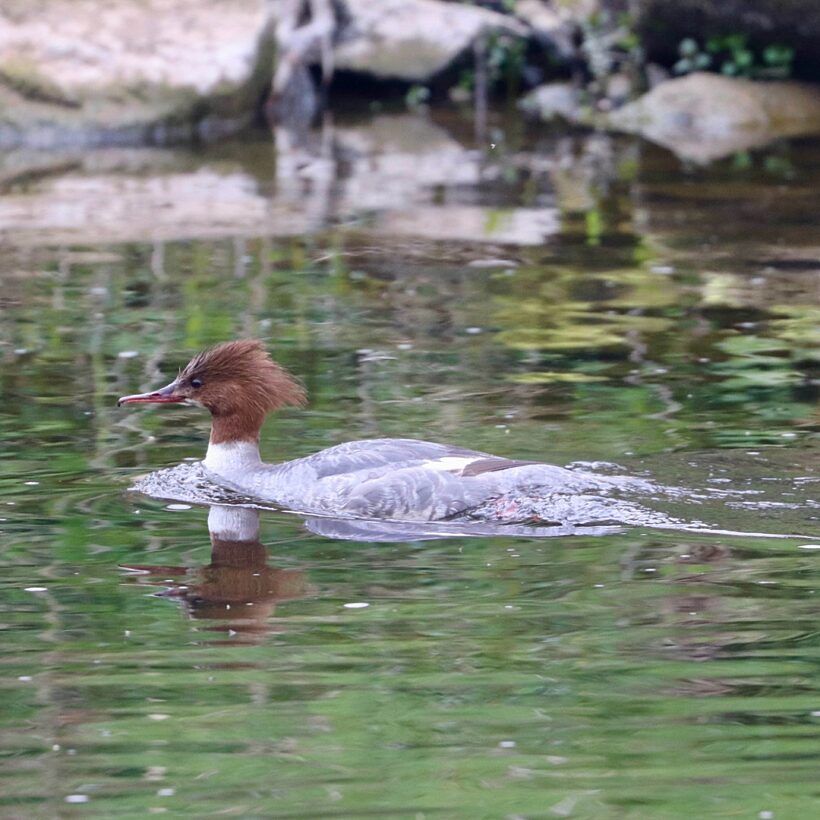
Four-time Big River Watch champions, ducks once again take the podium spot for the most common wildlife sighting, being recorded in 1,100 surveys. Second place goes to fish, with 636 recordings, followed by riverflies at 628. Close behind but not quite making the podium are the heron and swan, with 429 and 419 sightings respectively. 11 lucky surveyors saw a beaver and 148 caught a glimpse of the stunning kingfisher.
Your wildlife observations help shine a light on which species are thriving, where they’re being seen, and how river ecosystems are functioning. Beaver sightings are an exciting sign of ecological restoration, while riverflies are a key indicator of good water quality.
Pollution Persists
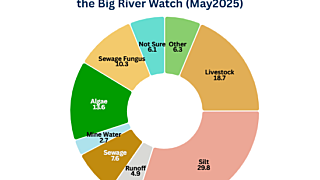
Though many surveys recorded wildlife, which can be a good indicator for the health of our waterways, it’s clear that our rivers are still under pressure. More than half of all surveys (54%) recorded at least one form of pollution.
Silt was the most frequently reported pollutant, with 547 sightings. Silt and soil often enter waterways after rainfall, but the weather during and leading up to the survey week was largely dry – in fact, April’s staggering amount of sunshine broke weather records in the UK, according to the Met Office. Restoring our soils, using cover crops and installing nature-based solutions like buffer strips and riparian tree planting can help us keep soil, silt and nutrients on land.
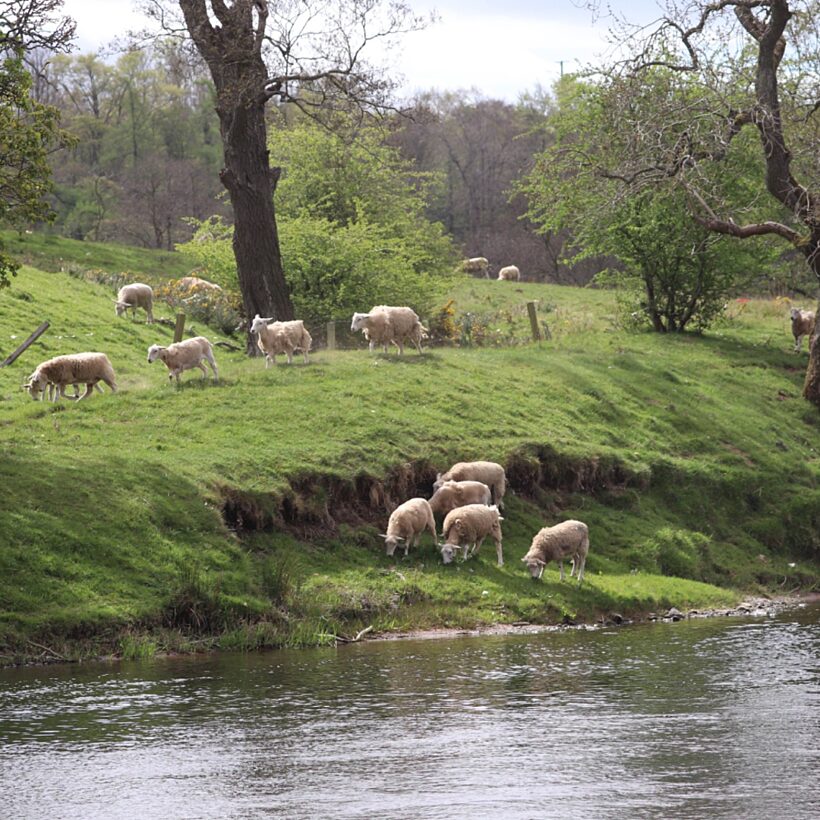
Livestock-related pollution came next, recorded in 343 surveys, a reminder of the impact of farm animals with direct access to riverbanks. Not only does this bring nutrient pollution (like nitrates and phosphates that can result in toxic algal blooms), but it can also introduce antibiotics and pathogens to river ecosystems, posing risks to both ecosystems and human health. Livestock presence on riverbanks can also damage vegetation and increase erosion, further degrading river habitats.
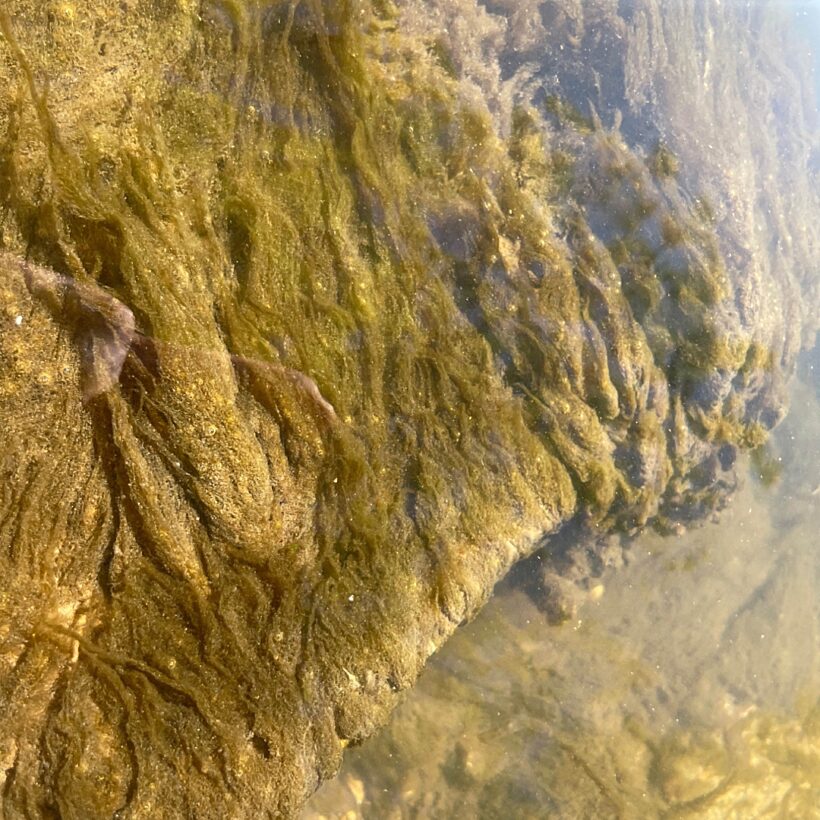
Algal blooms were recorded in 250 surveys. These often suggest high levels of nutrients in the water, which can come from agricultural runoff or untreated sewage. They become more common in the summer months in response to warmer temperatures, prolonged daylight hours, and the washing of spring fertilizer nutrients from farmland with rain.
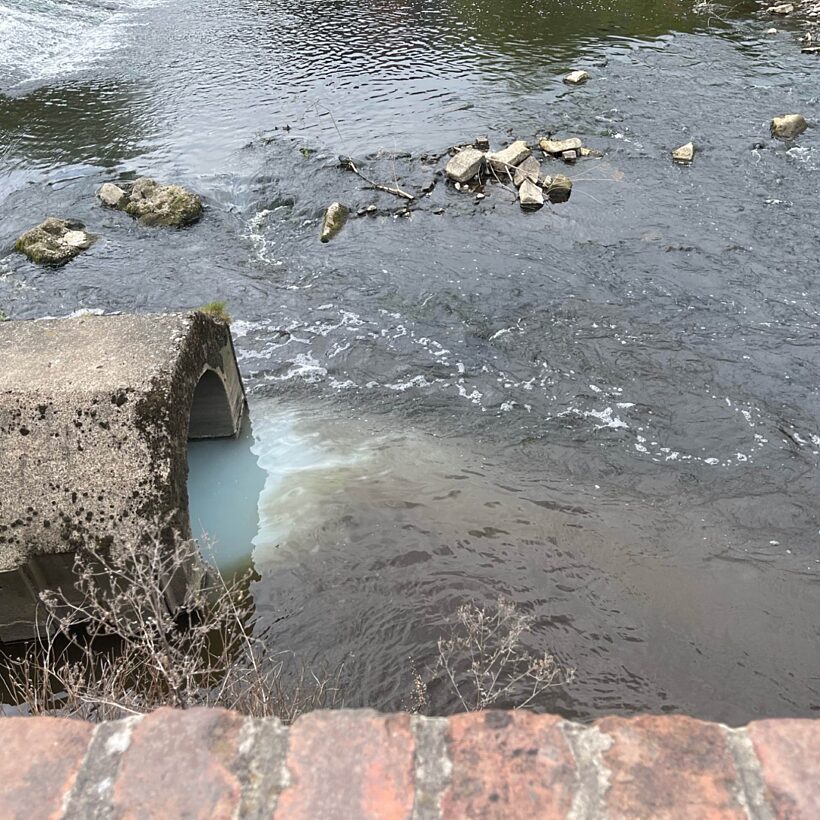
Sewage pollution itself was reported 139 times (featuring in 6.14% of surveys), while sewage fungus, a stringy grey-brown growth that thrives in polluted conditions and can indicate sewage pollution taking place over a long period, was seen in 189.
Other types of pollution were also noted. Road runoff, usually recognised by an oily or rainbow-like sheen on the water’s surface, was recorded in 89 surveys. Mine water, which can contain toxic metals and stain riverbeds, was reported in 50.
Your perception of and connection to rivers
Despite the high frequency of pollution and reports of litter (present in 50% of surveys), 70% of participants felt their river stretch looked healthy, while 22% said it looked unhealthy and 8% were unsure.
At first glance, that sounds promising but many of the biggest threats to our rivers are invisible to the naked eye. Chemical pollution, for example, affects all rivers in the UK and Ireland, but can’t be detected without lab testing.
Plus, participants are more likely to head out in dry and sunny weather, when signs of pollution like sewage or litter may be less visible. These often become more noticeable after rainfall, when overflows and runoff wash them into rivers.
Even with the app’s built-in pollution ID guide, spotting the signs isn’t always easy, especially for those new to citizen science. These results suggest there’s a growing need for better public education around river health and how to recognise environmental threats.
If you're curious about how people’s perceptions compare to official data, visit our interactive data explorer. Each survey appears on the map as blue or red, depending on whether the surveyor thought the river looked healthy or not. This can be compared to official ecological data under the Water Framework Directive, also colour-coded and visible when zoomed in.
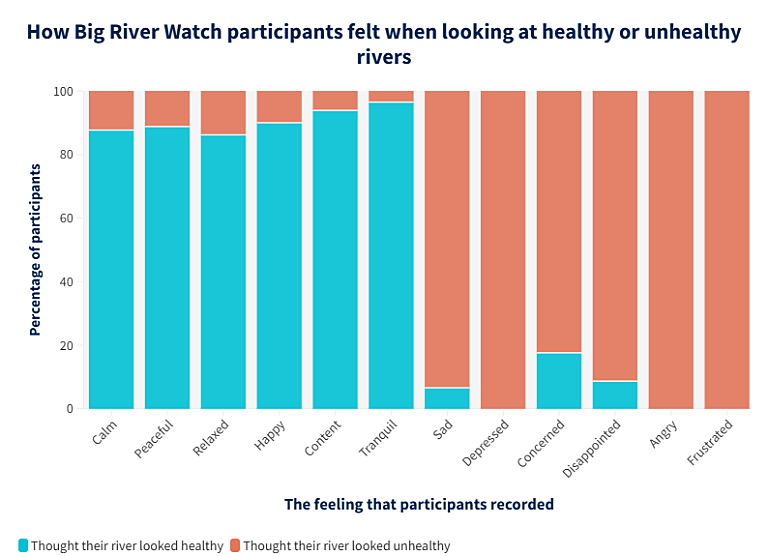
As with previous Big River Watch events, we asked participants to summarise how they felt during their river visit using a single word. These one-word responses are one of our favourite elements of the survey to explore and revealed a clear emotional connection to river health.
People who thought their river looked healthy most often described feeling calm, peaceful, or happy. Whereas those who felt their river looked unhealthy were more likely to say they felt sad, concerned, or frustrated.
These emotional responses remind us that the condition of our rivers isn’t just about nature, it directly affects our mental wellbeing and our relationship with the places we live. Clean, thriving rivers, full of nature, bring us peace and help foster a sense of pride in our local area. Polluted waterways, on the other hand, bring worry, frustration, and a sense of loss. Restoring our rivers doesn’t just benefit the environment, it helps improve the wellbeing of our communities, too.
Where you chose to survey: Exploring new spots vs visiting familiar stretches
Big River Watch offers a chance to reconnect with well-known and loved river spots, or to explore somewhere new. This time around, 181 surveys were conducted at brand-new locations, but over 700 surveys took place at locations that you report to visit at least every week!
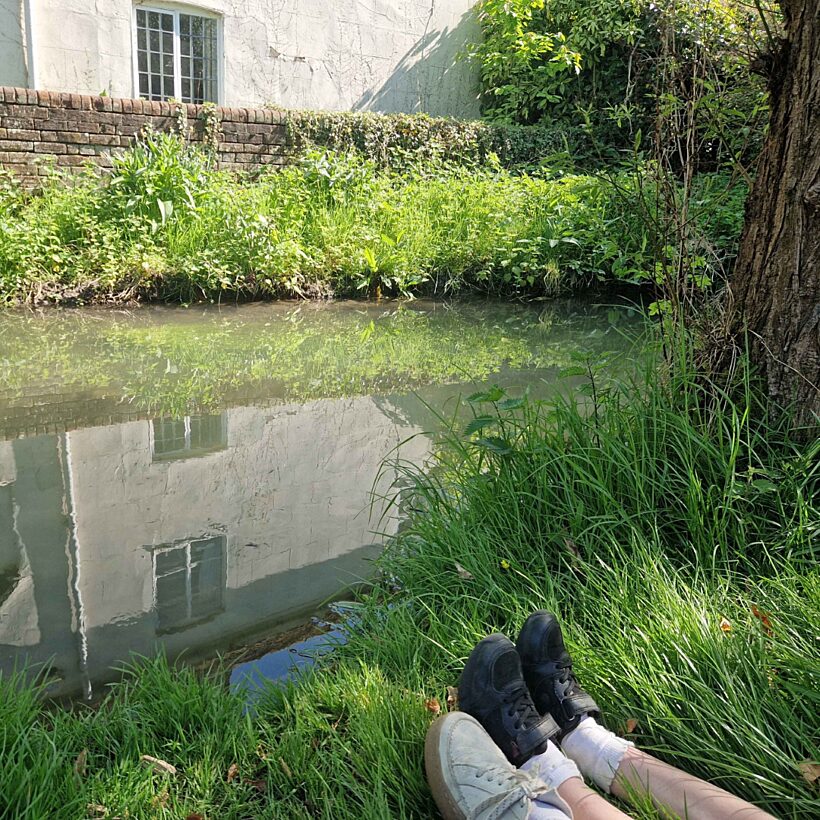
This tells us something important: rivers are woven into our daily routines. For many of us, they’re our favourite walking route, a place to sit with a cup of tea, walk the dog, meet friends, or enjoy a hobby. A few of you even chose to survey a river stretch from the garden of a pub or restaurant – the photos you shared made some of us envious! And, while we’re thrilled to help you uncover new blue spaces, seeing how many of you chose to stand up for a place you visit frequently filled us with hope. Our rivers need more champions, and this personal connection helps build care and stewardship for our waterways.
We also called out for help surveying our precious chalk streams – a vital and rare ecosystem of which England is home to 85% of the world's total! So, thank you to those of you who sent in the 263 surveys of chalk streams.
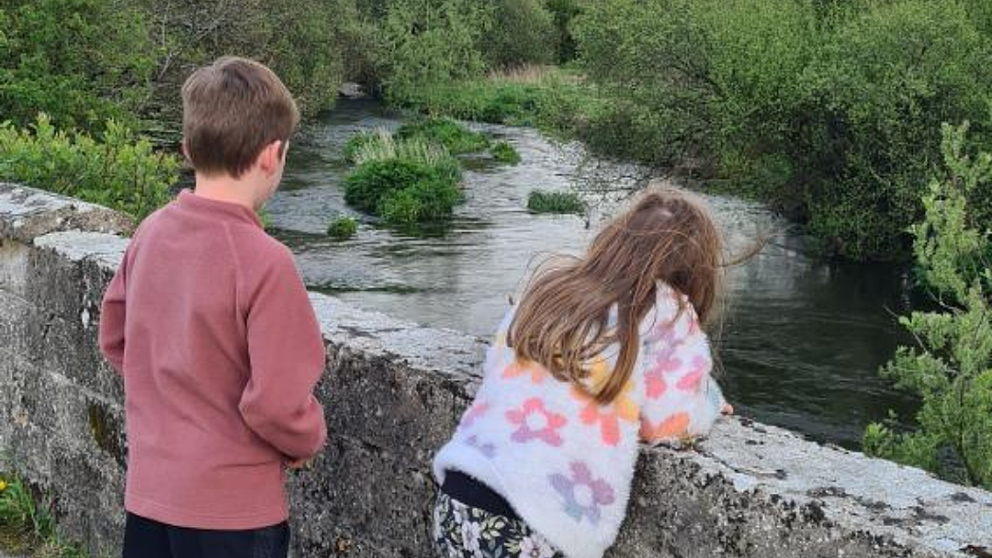
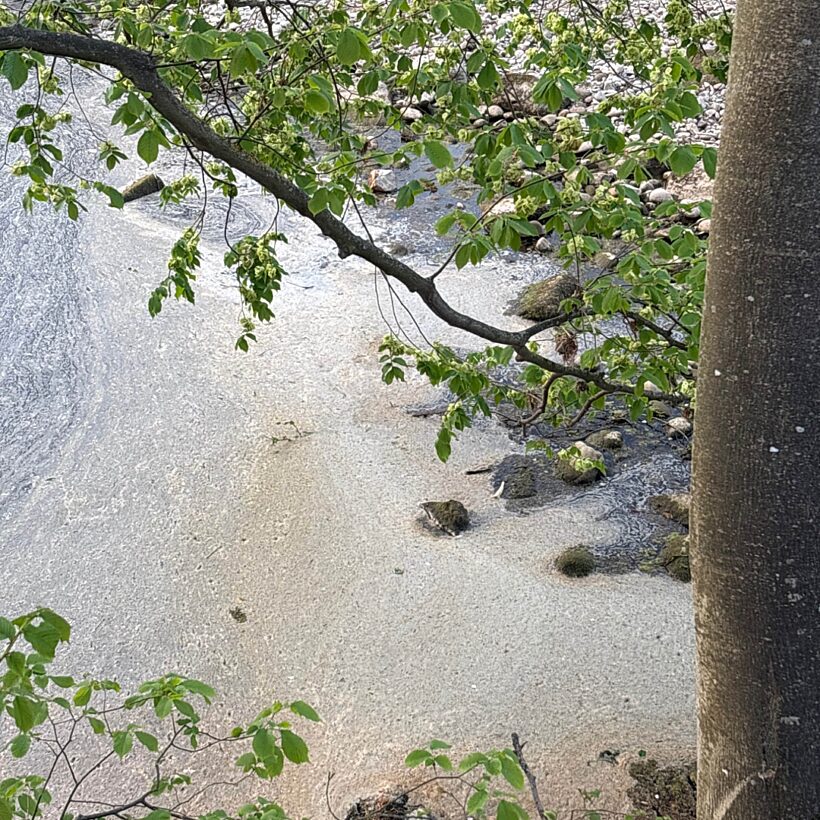
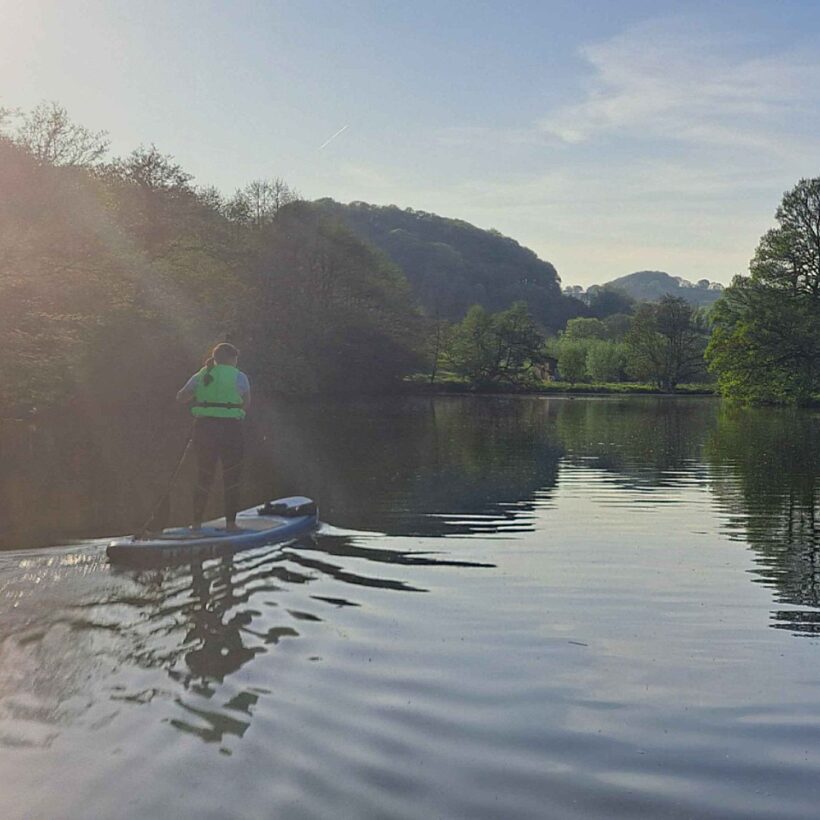
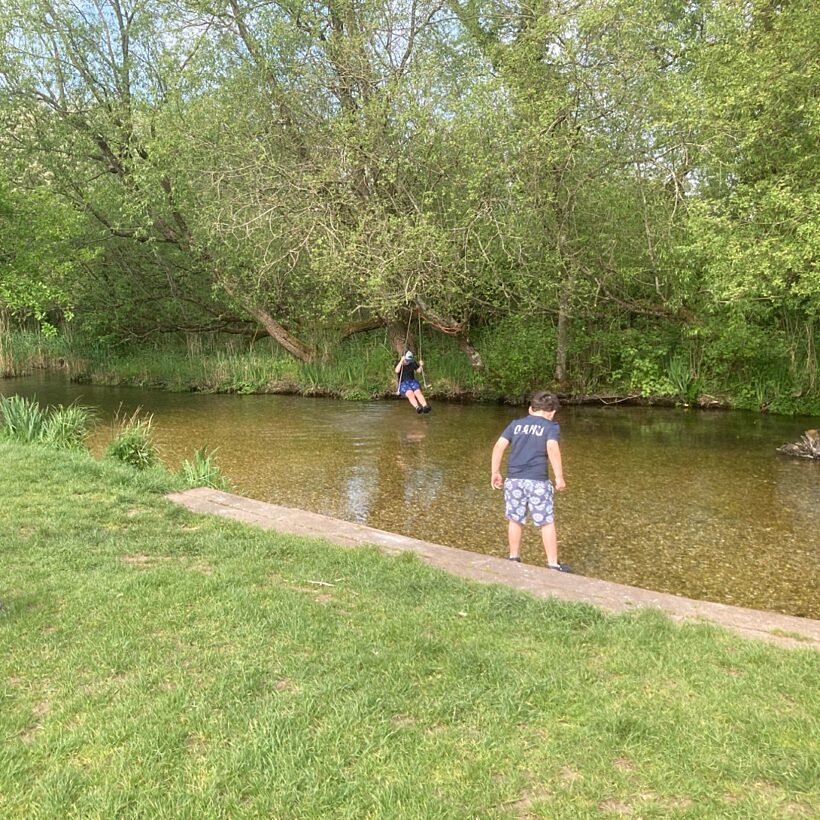
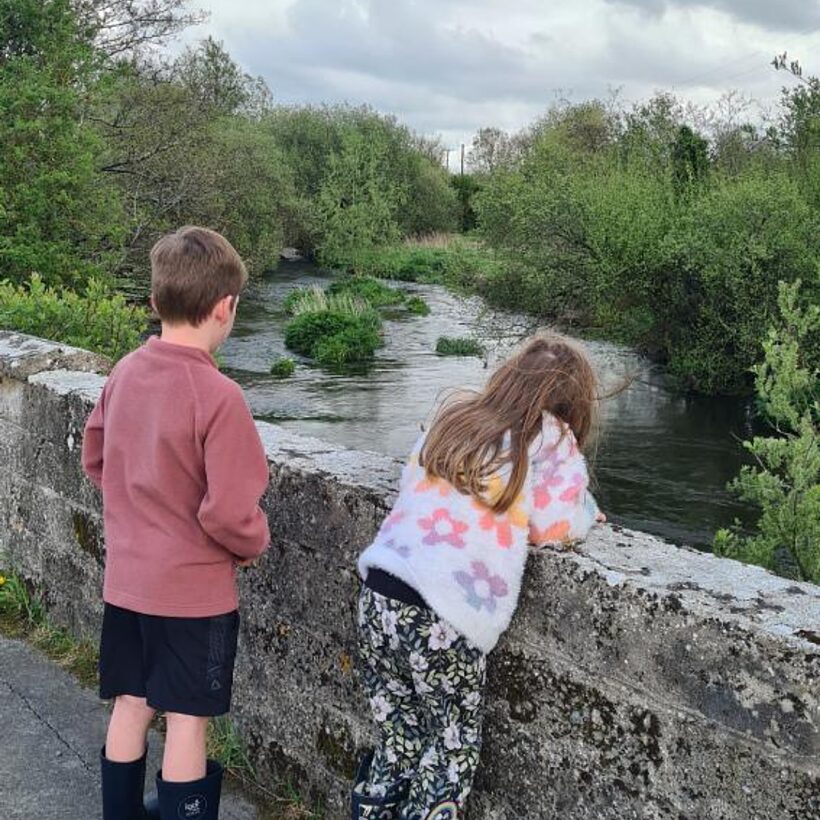
Your photos
Whether you discovered a new stretch of river or returned to your go-to spot, we loved all the photos of you enjoying our beautiful waterways.
Two years of Big River Watching
The wrapping up of our Spring 2025 campaign allows us to now are celebrate two years of Big River Watch! Since launching in 2023, we’ve run four seasonal campaigns, and over those survey weeks, a phenomenal 17,689 of you have stepped outside to explore and support your local rivers, submitting 10,027 surveys.
From the beginning, Big River Watch was designed to be a simple and accessible way for anyone to get involved in citizen science. We're especially proud that 7,183 people (58.6%) told us this was their very first citizen science experience. Whether it’s your first time or your fourth, thank you for being part of this growing river movement.
As for what you saw? Ducks have been the undisputed champions, appearing in nearly half of all surveys (49.46%), that’s an incredible 4,500 sightings! But while there’s been plenty of beauty and wildlife recorded, there’s also been cause for concern. More than half of all surveys (55%) reported signs of pollution, and 4,959 included visible litter - a stark reminder of the challenges our rivers continue to face.
We’re also thrilled that many of you want to continue standing up for rivers! Thousands of participants have chosen to connect with their local Rivers Trust to hear about local events and volunteering opportunities, and even more have opted in to staying in touch with us by signing up to our newsletter to support national river health campaigns,
A huge thank you to everyone who has taken part in any (or all!) of our Big River Watch events. It’s been inspiring to watch more people reconnect with rivers, embrace citizen science, and help create a big picture of river health across the UK and Ireland.
In 2025. we've seen Big River Watch particularly grow in popularity across Ireland, and so, as our brilliant ambassador Manchán Magan puts it:
“It’s fantastic to see ever more individuals and communities safeguarding the vitality and ecological diversity of their localities. A classic example is the success of The Rivers Trust's Big River Watch, which encourages communities to become personally involved in the health of their local ecosystem. Using an app they get to monitor the health of their local river system by observing it keenly for 15 minutes and recording everything they see. Each report provides a pen picture of a river’s health, and once aggregated they build up to something really valuable.
“We tend to malign our mobile phones, yet using the Big River Watch app is a classic example of the great benefits they can bring. Twice a year the public gets to monitor and report on the health of their local river and submit it to the River Trust’s central database via the app. Together these reports provide an invaluable sense of the health of our river systems that is built up using the collective power of citizen science.”
What’s next?
Has Big River Watch sparked your interest in citizen science? There are so many ways to get involved. Check out our blog, Citizen Science: 10 ways you can get involved in the fight for cleaner rivers, for ideas on how to continue your journey.
Big River Watch takes place twice a year, and we’ll be back in September for our next week of river surveying. But don’t wait until then until then, the app stays open year-round, and any data you submit outside of official Big River Watch weeks is still valuable. Our local Trusts and partner organisations can use it to inform restoration work and monitor change over time.
Other ways to help
- Find your local Trust: Many of our member Trusts offer hands-on volunteering like litter picks, tree planting, balsam bashing and riverfly monitoring. Find your local Trust here.
- Explore the data: Use our interactive data explorer to dive into survey results from all four Big River Watch events.
- Learn more: Read our State of Our Rivers Report to understand the key issues, the condition of our rivers, and what needs to be done to restore them.
- Register for Earthwatch's next Great UK WaterBlitz and combine your September Big River Watch with a further citizen science activity and test the water yourself.